Node Info
Overview
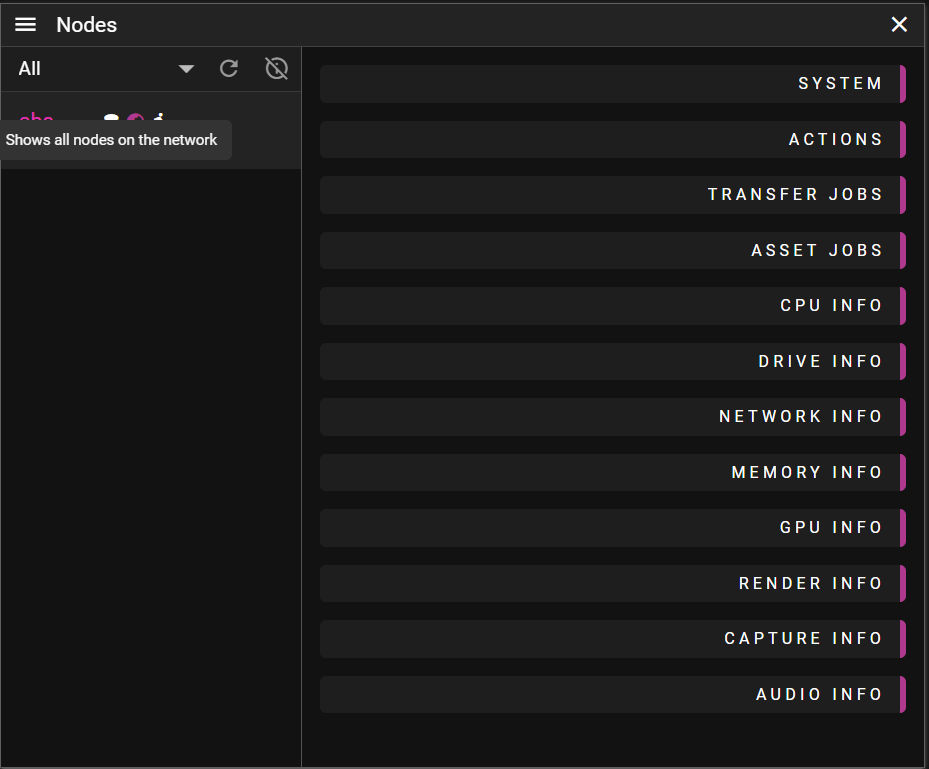
The Node Information Panel is a comprehensive dashboard for monitoring and managing individual nodes within your network. This detailed interface provides in-depth system information, performance metrics, file transfer status, and administrative controls for each connected device.
Information Categories
The Node Information Panel is organized into collapsible sections, each focused on a specific aspect of the selected node:
System
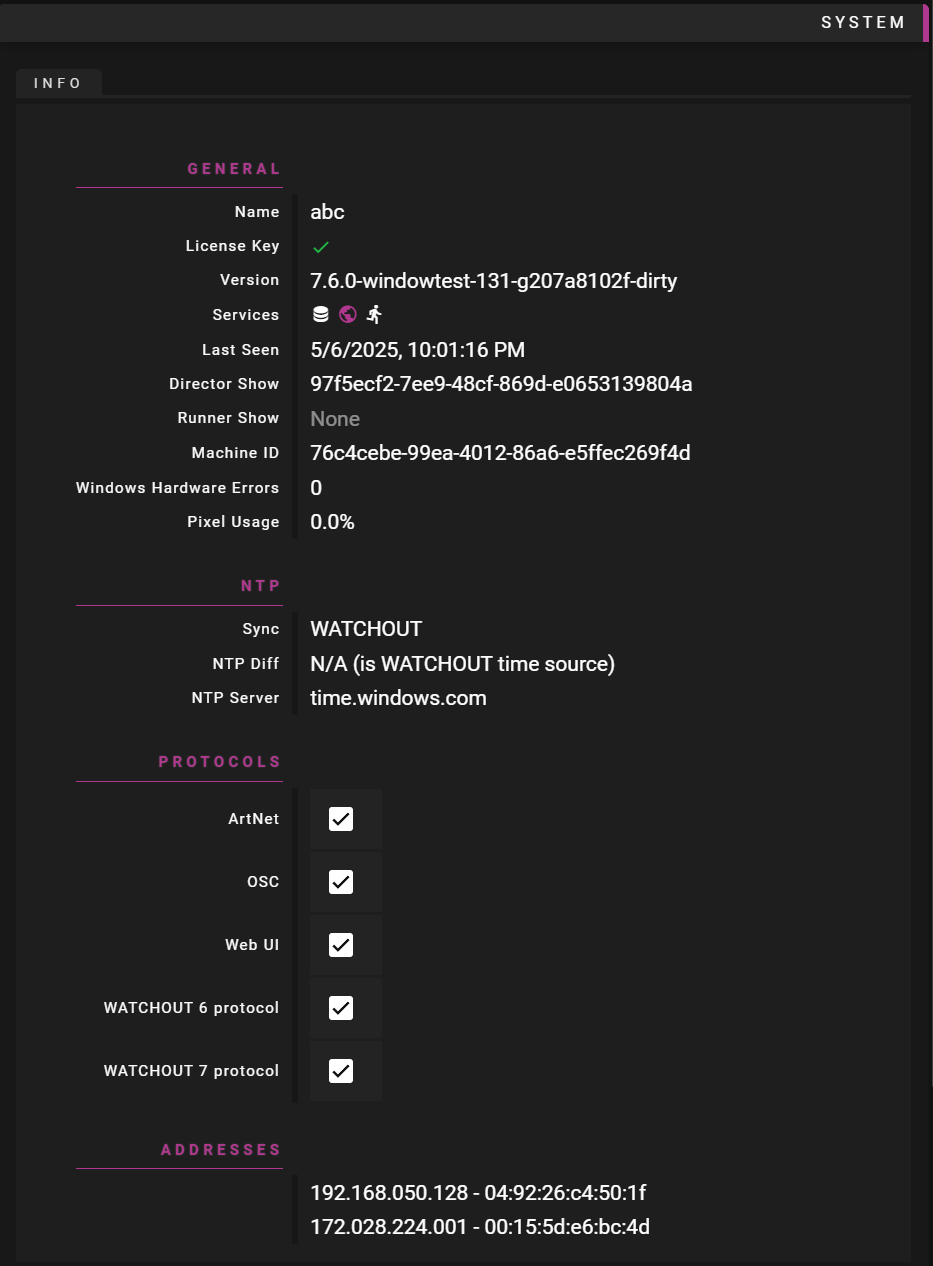
Displays essential information about the selected node. Also allow you to toggle what protocols your node responds on. Do this on the Director node, or Asset Manager node.
System Actions
Provides administrative controls for the selected node. See the Node List documentation for details.
Transfer Jobs
Displays file transfer operations in progress:
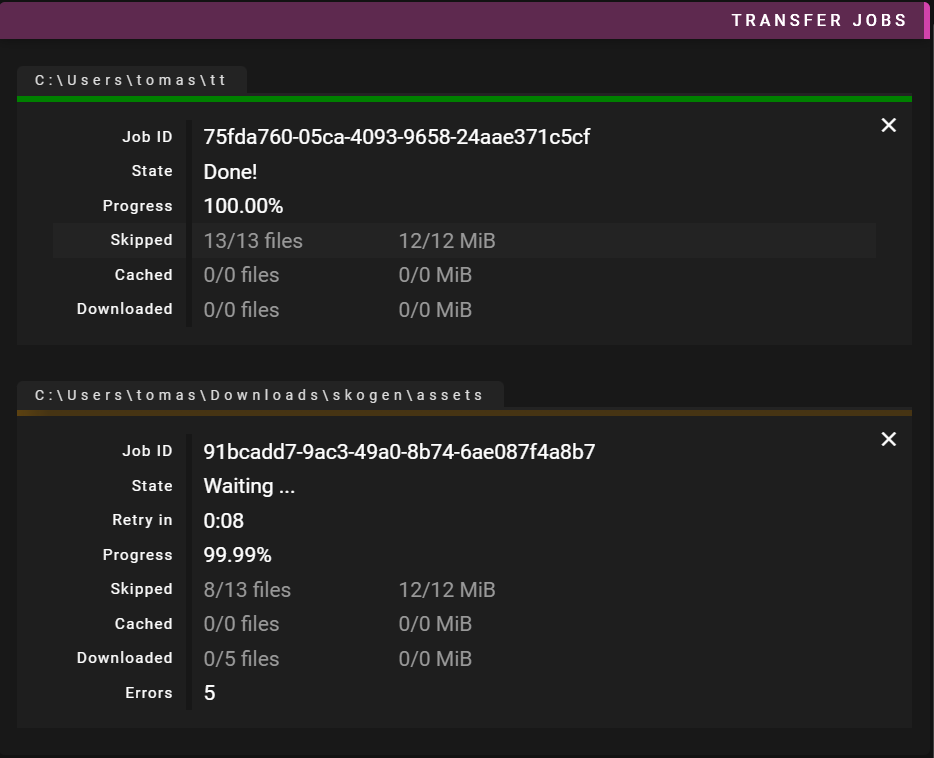
- Status Information:
- State: Current operation status (pending, working, success)
- Schedule: Time until operation begins
- Progress: Percentage complete
- Skipped Files: Files bypassed due to existing copies
- Copied Files: Local files copied
- Downloaded Files: Remote files retrieved
- Errors: Issues encountered during transfer
- Current Files: Files being processed
Hardware Monitoring
Multiple sections provide detailed hardware metrics:
-
CPU Info: Usage statistics and charts for each processor
-
Drive Info: Space usage and read/write rates with performance graphs. Note this does not currently work with raid systems.
-
Network Info: Upload and download bandwidth with traffic visualization
-
Memory Info: RAM utilization with usage trend charts
-
GPU Info: Graphics processor details with utilization graphs:
- General GPU usage
- Video encoder utilization
- Video decoder utilization
-
Render Info: Performance metrics for media playback:
- Frames per second
- Dropped media frames
- Dropped capture frames
-
Capture Info: Camera and video capture device details
-
Audio Info: VU meters for audio level monitoring
Interactive Features
Progress Tracking
File transfers and processing operations show:
- Colored progress bars indicating status
- Percentage completion indicators
- Real-time speed metrics
- Estimated time remaining
Error Handling
For operations with errors:
- Expandable error details (click arrow to expand)
- Timestamps for each error
- Descriptive error messages
- Color-coded indicators
Job Management
For active jobs:
- Cancel individual jobs with the close button (×)
- "Close All Jobs" button to cancel all operations
- Indeterminate progress for pending operations
- Color-coded status indicators
Usage Tips
- Collapsible Sections: Click section headers to expand/collapse for focused viewing
- System Actions: Use buttons in the Actions section for remote management
- Monitoring During Show Creation: Keep hardware sections open to profile performance in real-time
- Job Management: Cancel unnecessary transfers to free up bandwidth
- Error Troubleshooting: Expand error details for troubleshooting information
- Monitor capture info: Get real-time updates on capture sources used
Node Info provides comprehensive insight into a node in your network, allowing for efficient monitoring and management of all system resources from a single interface.