Dashboard
Overview
The Node Metrics Dashboard provides real-time performance monitoring for all devices in your WATCHOUT 7 network. This powerful visualization tool helps you track system resources, identify bottlenecks, and ensure optimal performance across your entire production environment.
Dashboard Features
The Node Metrics Dashboard presents performance data in an intuitive grid layout with the following capabilities:
- Real-time Monitoring: View live performance metrics from all connected devices
- Customizable Layout: Pin important metrics for focused monitoring
- Detailed Charts: Analyze resource usage trends with interactive charts
- Fullscreen Mode: Maximize any chart for detailed analysis
- Category Filtering: Groups metrics by resource type
Interface Layout
The dashboard is organized into clearly defined categories:
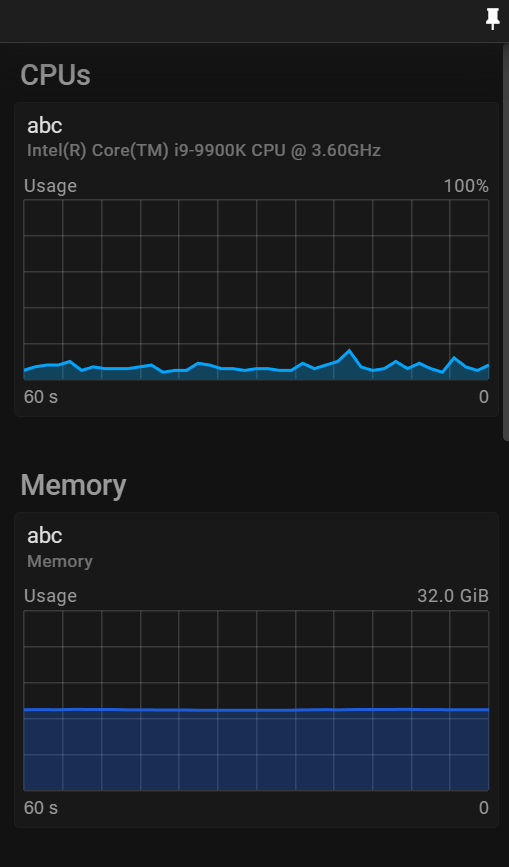
- CPUs: Processor utilization across all cores
- Memory: RAM usage and availability
- GPUs: Graphics processing unit utilization, memory usage, and temperature
- Networks: Upload and download bandwidth consumption
- Drive Reads: Storage read operations and speeds
- Drive Writes: Storage write operations and speeds
- Render Info: Frame rates and dropped frame statistics
- Audio: VU meters for audio level monitoring
Monitoring Charts
Each metric is displayed as a card containing:
- Host Reference: The device name providing the metric
- Metric Name: The specific resource being monitored
- Chart: Real-time visualization of the metric data
- Fullscreen Button: Expands the chart for detailed analysis
Working with the Dashboard
Viewing All Metrics
By default, the dashboard displays all available metrics from all connected devices. Scroll through the categories to view different resource types.
Customizing Your View
Pinning Important Metrics
- Click the Pin icon (📌) in the top right corner to enter edit mode
- Click on any metric card to toggle pinning (pinned charts appear highlighted)
- Click the Checkmark (✓) to save your selection and exit edit mode
Only pinned charts will remain visible after exiting edit mode, allowing you to focus on your most important metrics.
Clearing Pinned Metrics
While in edit mode, click the Restore (↺) button to clear all pinned metrics and return to the default view.
Detailed Analysis
Fullscreen Mode
Click the Fullscreen (⛶) button on any chart to maximize it for detailed analysis. This view provides:
- Chart title and host reference
- Expanded visualization
- Exit button to return to the grid view
Press the Fullscreen Exit button or Esc key to return to the dashboard.
Keyboard Navigation
- Escape: Exit fullscreen mode or edit mode
- Ctrl+Click: Enter edit mode and select chart (same as using the pin icon (📌) )
- Space: Toggle pinned status while in edit mode
Using Performance Data
Resource Management
Monitor CPU, GPU, and memory usage to:
- Identify overloaded devices
- Balance workloads across your network
- Detect performance bottlenecks
GPU Monitoring (NVIDIA only)
The GPU section includes dedicated charts for:
- GPU Utilization: Processing load on the graphics card
- GPU Memory: Video RAM usage for texture and frame buffer allocation
- GPU Temperature: Thermal monitoring to prevent overheating
High GPU temperatures or memory pressure can indicate the need to optimize content or distribute load across additional devices.
Storage Performance
Track disk read/write operations to:
- Ensure media files load efficiently
- Identify slow storage devices
- Monitor available space
Network Analysis
Monitor upload/download rates to:
- Identify bandwidth constraints
- Optimize asset distribution
- Troubleshoot connection issues
Rendering Performance
Watch render metrics to:
- Ensure consistent frame rates
- Detect dropped frames
- Optimize performance-intensive content
Audio Monitoring
The Audio section provides VU meters for each device, allowing you to:
- Monitor audio levels across outputs
- Detect audio signal problems
- Balance levels between different devices
Best Practices
- Pin Critical Metrics: Focus on the metrics most relevant to your current production
- Fullscreen During Setup: Use fullscreen mode during technical setup to fine-tune performance
- Regular Monitoring: Check the dashboard periodically during shows to catch issues early
- Look for Patterns: Watch for trends that might indicate developing problems
The Node Metrics Dashboard is an important tool for maintaining performance across your WATCHOUT 7 network, ensuring smooth and reliable operation during critical productions.